
OVERVIEW
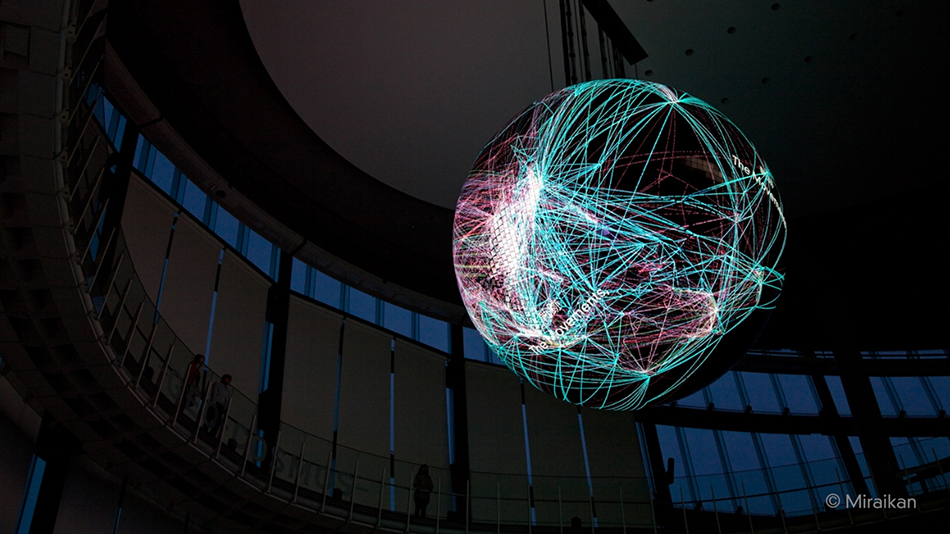
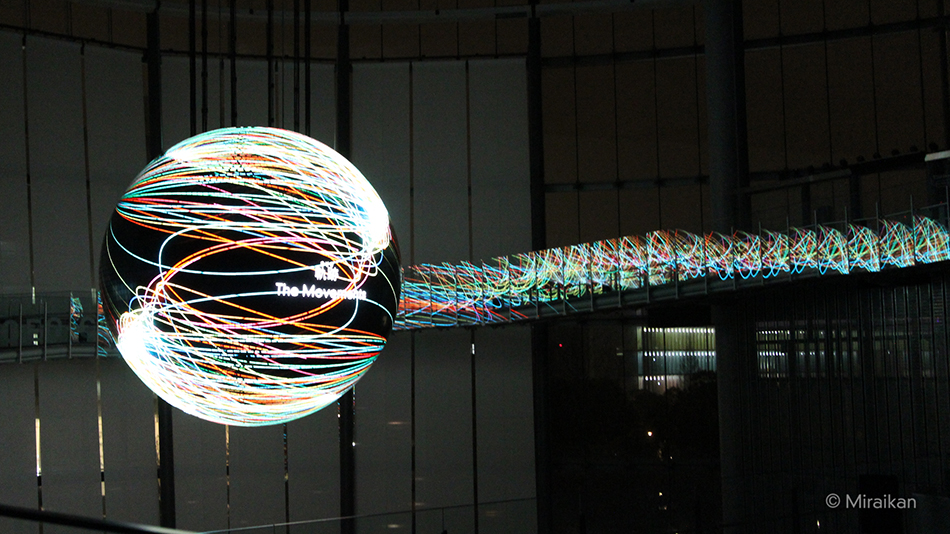
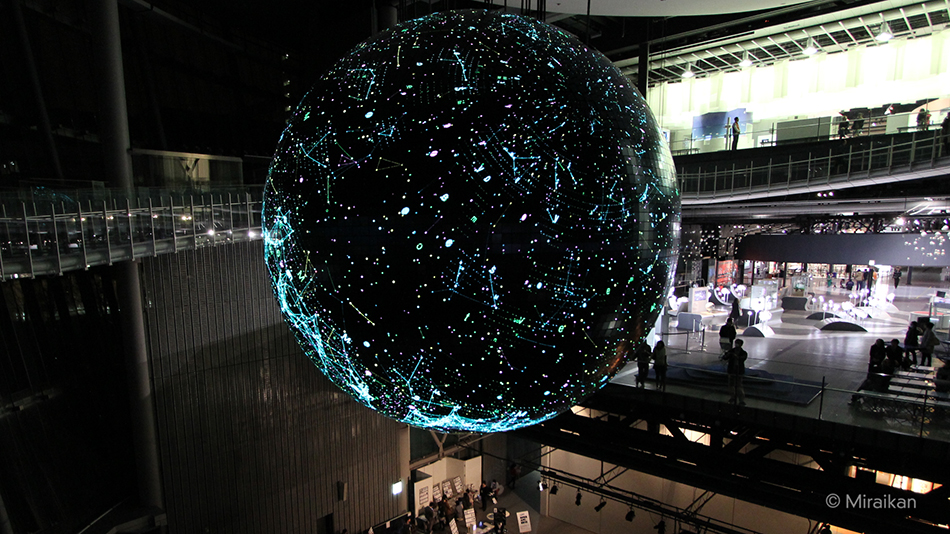
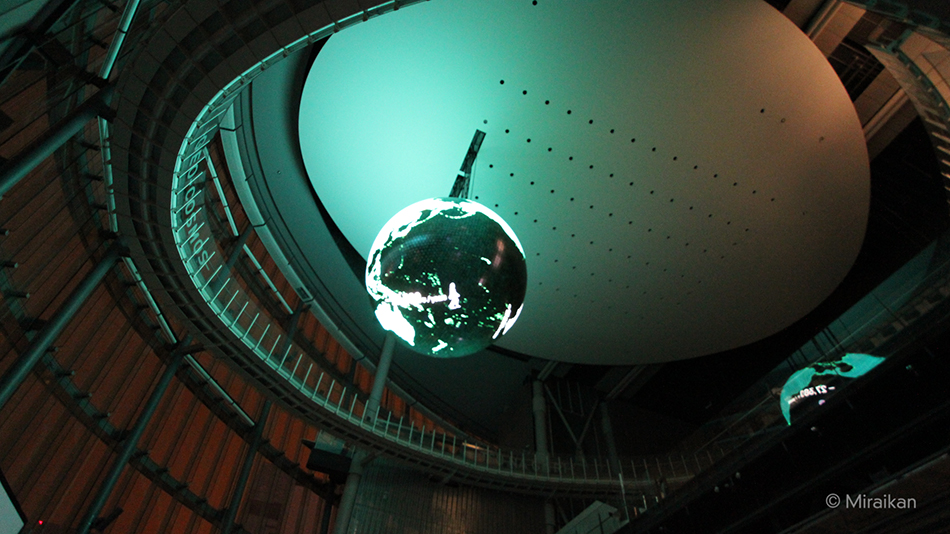
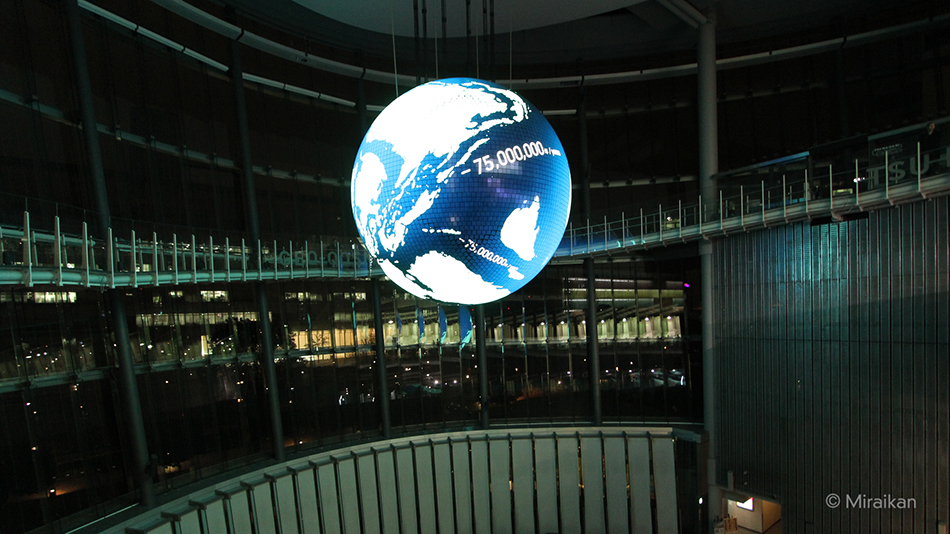
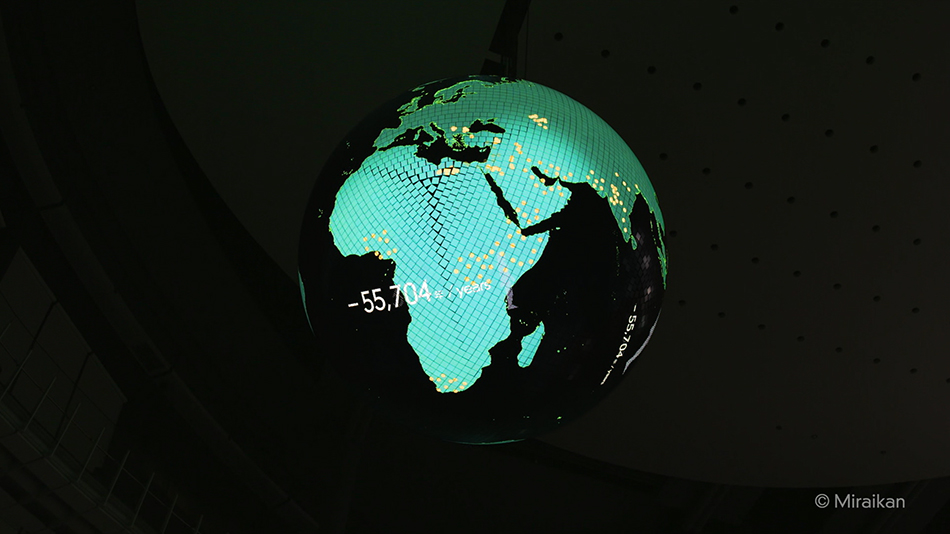
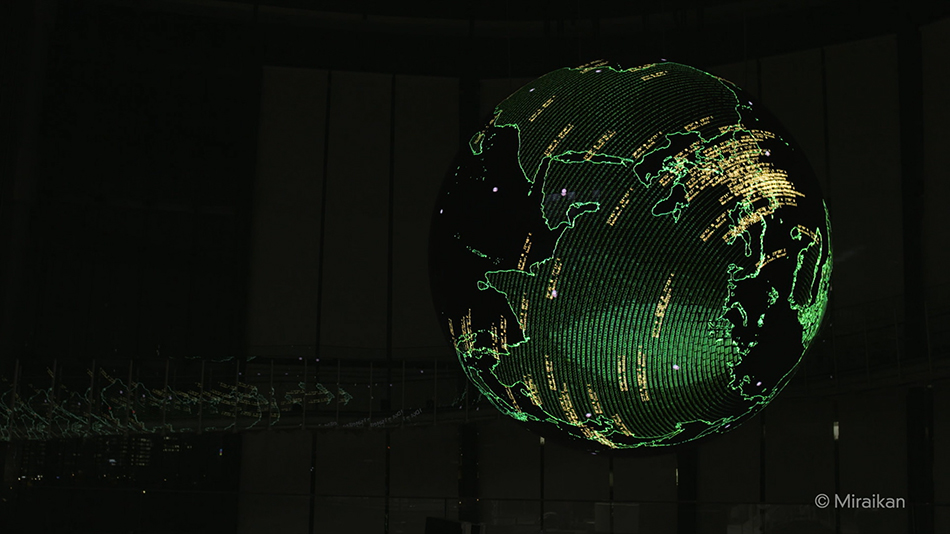
For permanent exhibition on globe-shaped display "Geo-Cosmos" set in the Symbol Zone of Miraikan, National Museum of Emerging Science and Innovation, we directed 8-min piece of content with the theme of human migration, which consists of data visualization. Various incidents which can be retrieved through scientific data surrounding the globe are presented with beautiful data visualization without using words for explanation as much as possible. We can intuitively grasp an overview of human migration and various incidents by watching this art piece.
日本科学未来館シンボルゾーンにある球体ディスプレイ「ジオ・コスモス」の常設コンテンツとして、人類の移動をテーマにしたデータビジュアライゼーションで構成された8分間のコンテンツを演出しました。
地球をとりまく科学データから得られる事象を、言葉による説明を極力少なくした美しいデータビジュアライゼーションで表現しました。
人類の移動の変遷や事象が俯瞰視的かつ直感的に理解できるような作品です。
Beautiful High-definition display
This has significant presence by fully utilizing the charm of high resolution globe-shaped display which can show 1 pixel in 6K.
圧倒的な存在感があり、6Kで1ピクセルまで表示する高解像度の地球ディスプレイの魅力を活かした演出を計画しました。
360°Infographics
As facets will change depending on viewpoints, everyone can enjoy 360-degree infographics from each and every angle.
観る場所によっても様相を変えながら、どの角度からも伝わる360度のインフォグラフィックスが展開していきます。
CONCEPT
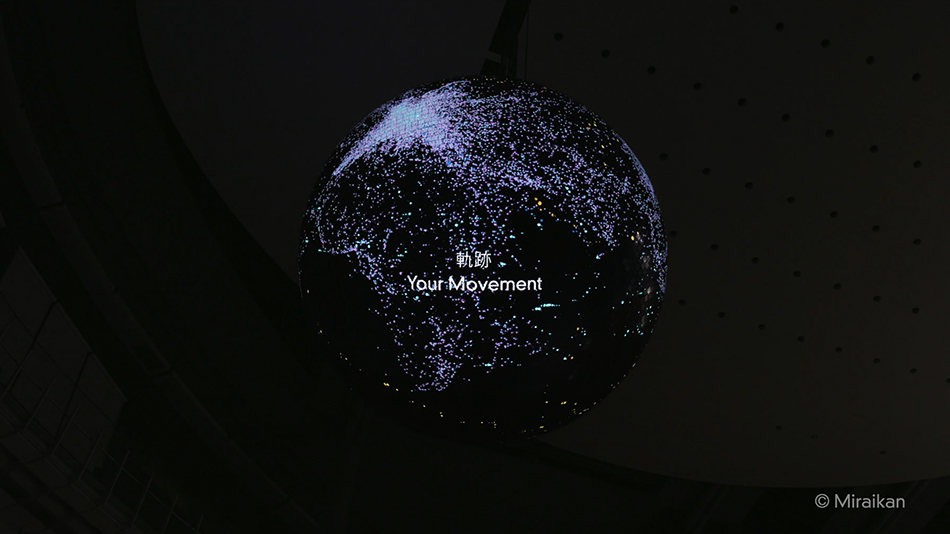
During the length of 8 minutes, this piece has nine (9) parts of data visualization on the canvas of the globe where the earth and human migration are depicted. Its highlights are as follows:-
本作は8分間のなかで、地球をキャンバスに9つのデータビジュアライゼーションで地球と人類の移動の軌跡を描いています。
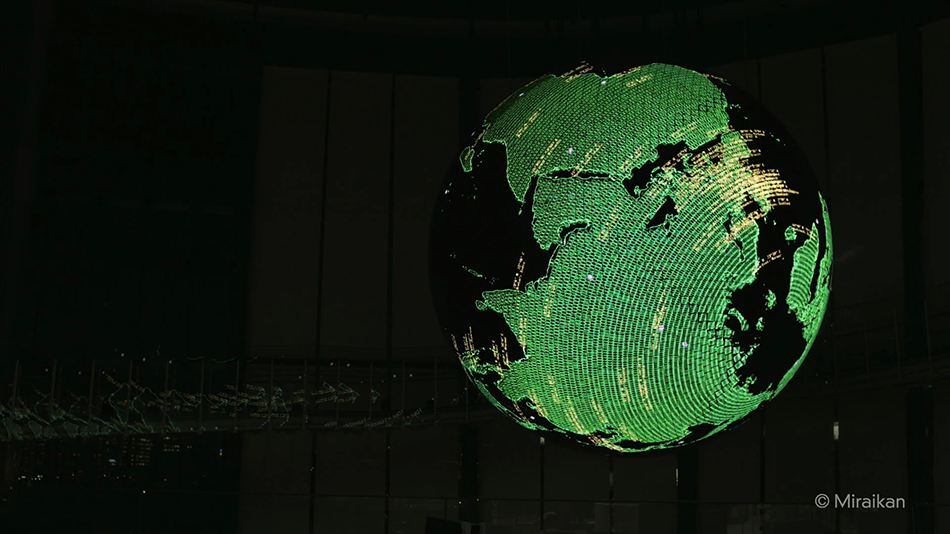
- INTRO "ANCIENT MOVEMENT"
While a feature part of this piece faithfully follows scientific data, we tried to abstractly express the images of the earth before congelation of magma in ancient times in the intro part - Ancient Movement. Since all parts of a feature are based on correct data visualization, the tone of abstract images is used for expression in this intro part.
●INTRO 「Ancient Movements」
科学に忠実な本編に対して、Ancient Movementsとしてイメージしたイントロは、古代のマグマが固まる前の地球のイメージを抽象的なに表現したパートです。ここから続く本編は、すべて正確なデータビジュアライゼーションによるパートになるため、イントロパートでは抽象的なイメージで作品のトーンを表現しました。
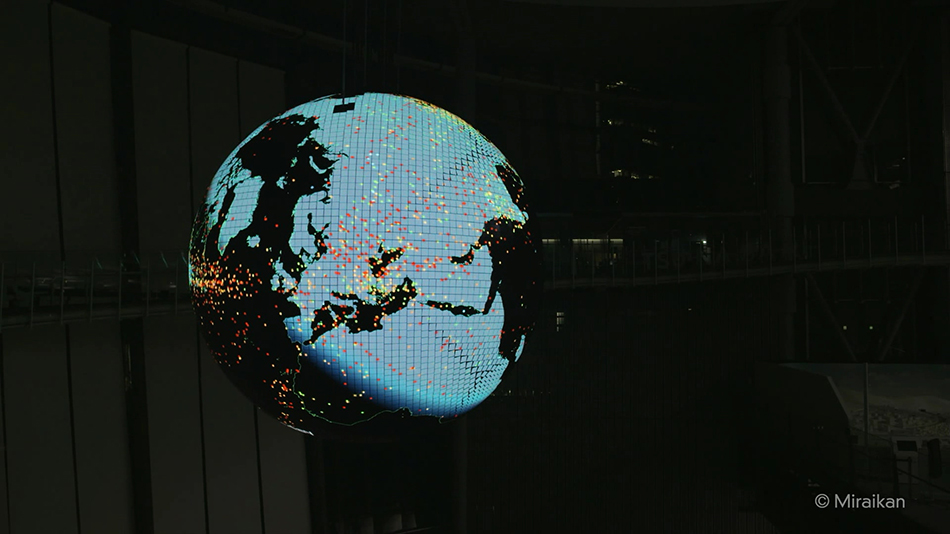
- CONTINENTAL DRIFT AND HUMAN MIGRATION
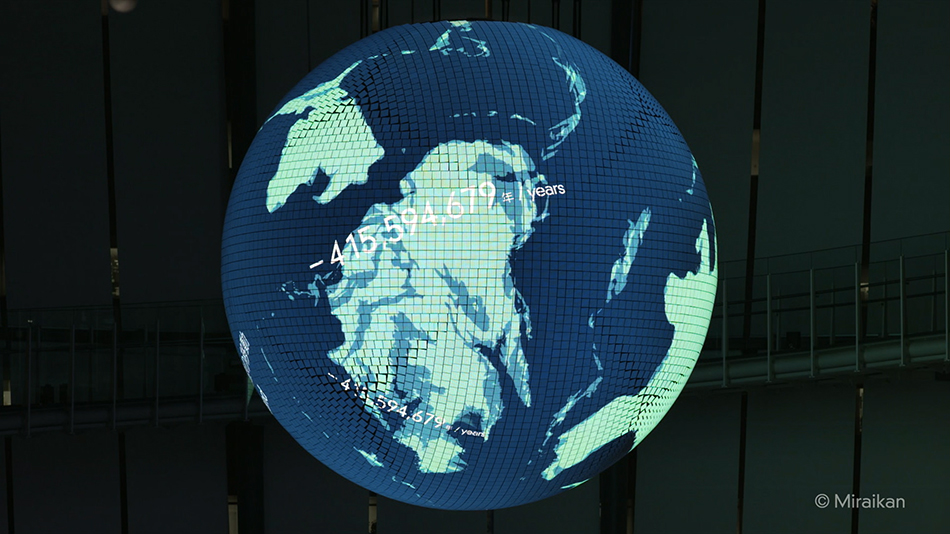
How continents of the earth have changed and transformed into the current forms? How human ancestors have spread all over the world from Africa? We created animation sequences which will give you a feel for the speed of such spread.
*“CONTINENTAL DRIFT” References: Northern Arizona University
●大陸移動と人類の移動
地球の大陸がどのような変遷をたどり現在の形になったのか、そしてアフリカで生まれた人類の祖先はどのように世界に広がっていったのか、拡散のスピード感も体感できるようなアニメーションを表現しました。
大陸移動データ出典:ノーザンアリゾナ大学
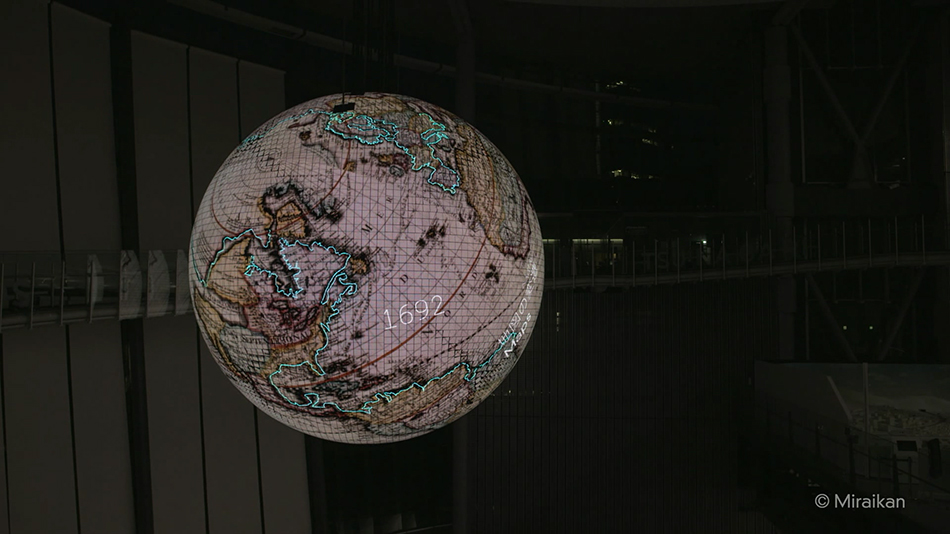
- Transition of Maps
Various maps before the Age of Discovery when people did not realize global shape of the earth have been layered over the current shape of the earth, which illustrates how the ridge lines of the earth recognized by the human race have changed.
For layering over the shape of the globe various maps of the time when the earth was believed to be flat, we collaborated with Mr. Hajime Narukawa who invented Authagraph projection.
●地図の変遷
人類が「地球が丸い」という認識を持つ以前の航海時代の地図などを現在の球体の地球の上に重ねて展開していきました。
人類の認識していた地球の稜線がどのように変わっていったかがわかります。
「世界が平面にある」と思われていた時代の地図を球体に描きおこすために、オーサグラフ開発者の鳴川肇氏の協力をいただきました。
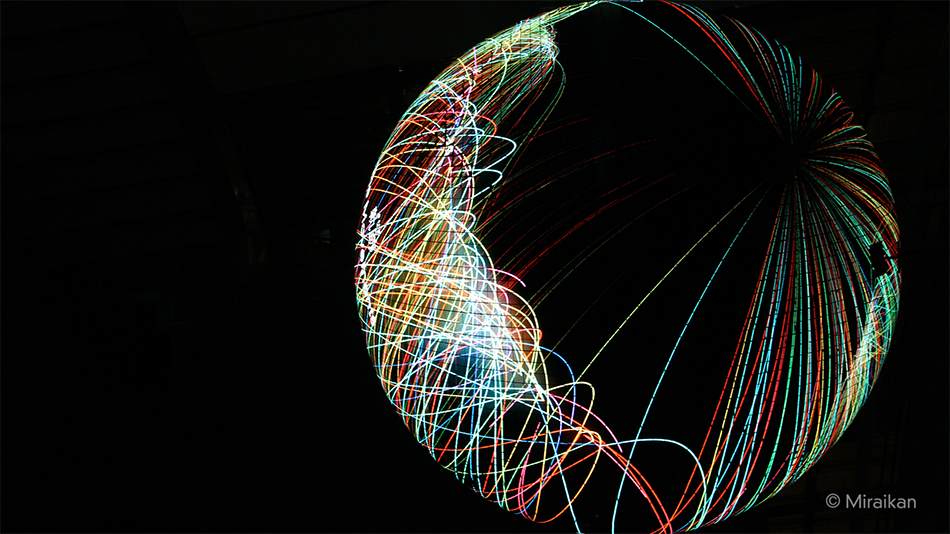
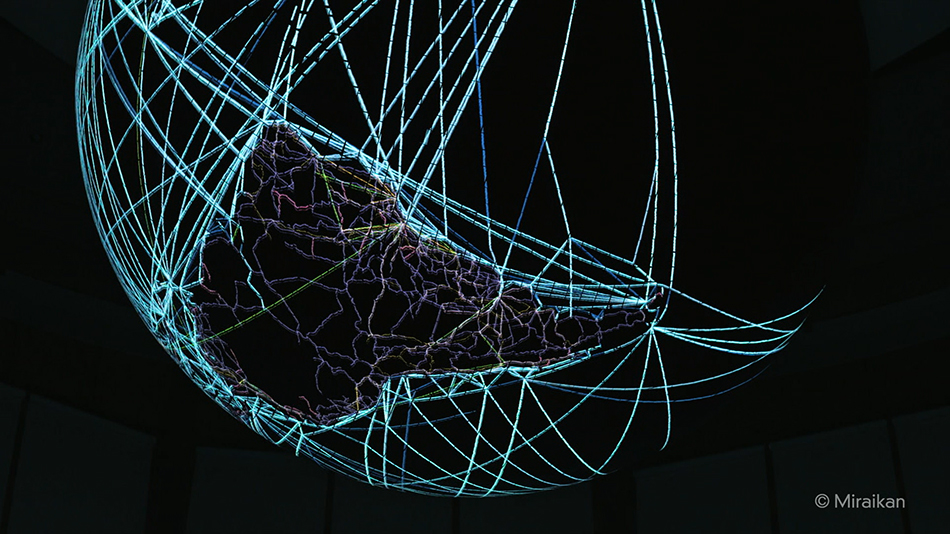
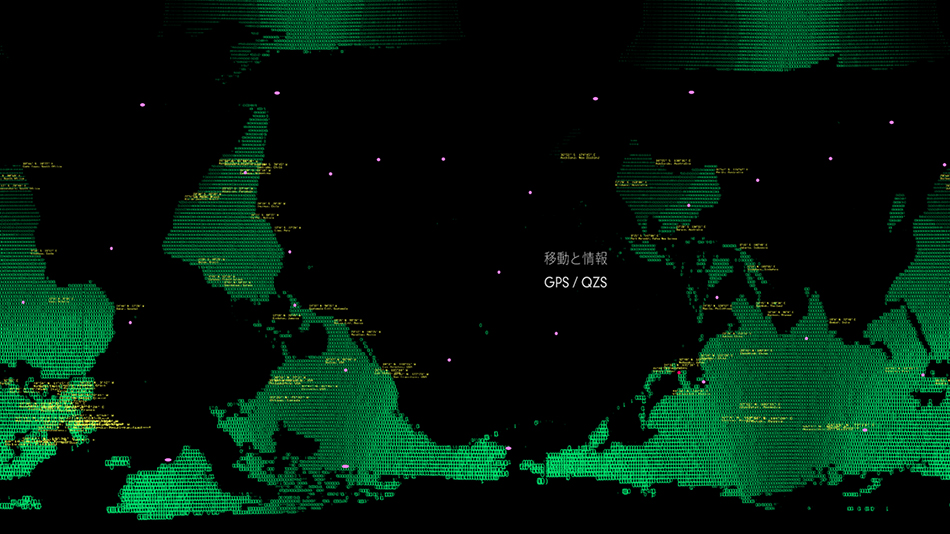
- GPS satellites / QZ satellites - The earth drawn by GPS satellites:
Using 52 Artificial satellites (which number is available at the time of production of this piece), people can obtain the data of their location wherever they are located on the earth. We also draw the orbit of Japan's satellite system "MICHIBIKI" (QZS) which measures the position information with high accuracy.
By depicting how the human race has recognized total picture of the earth by voyage and/or measurement since ancient times and how such total picture has changed, it is also possible to understand how the earth on which the human race lives has been recognized as well as its transition.
●GPS衛星によって描き出される地球
52個(制作当時)の人工衛星から人類は地球上にいながら、自分自身の位置データを取得しています。本作では、位置情報を高精度で測位する日本の衛星システム「みちびき」(QZS)の軌道も描画しました。古代より人類が航海や測量で認識してきた地球の全体像の変遷と同じパートで表現することで人類が自分自身のいる地球をどのように認識しているかの変遷を感じることができます。
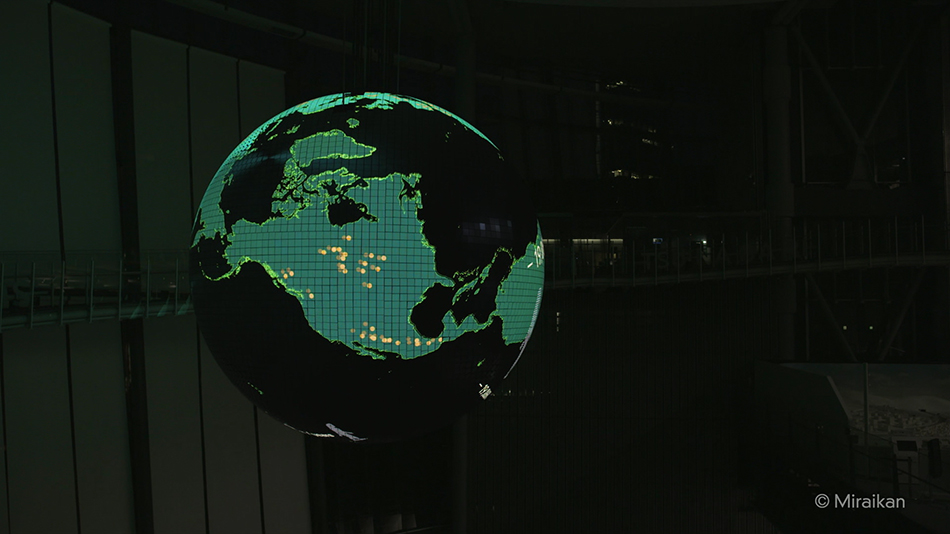
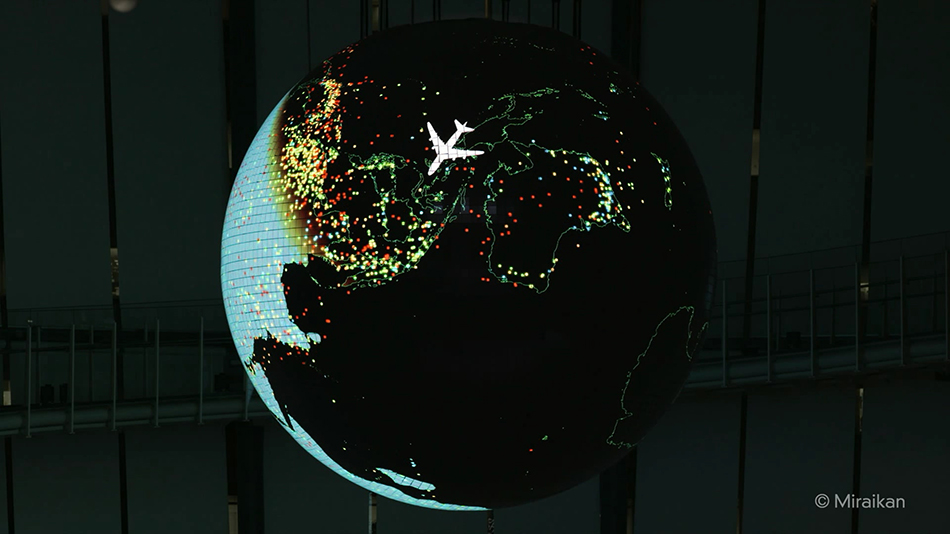
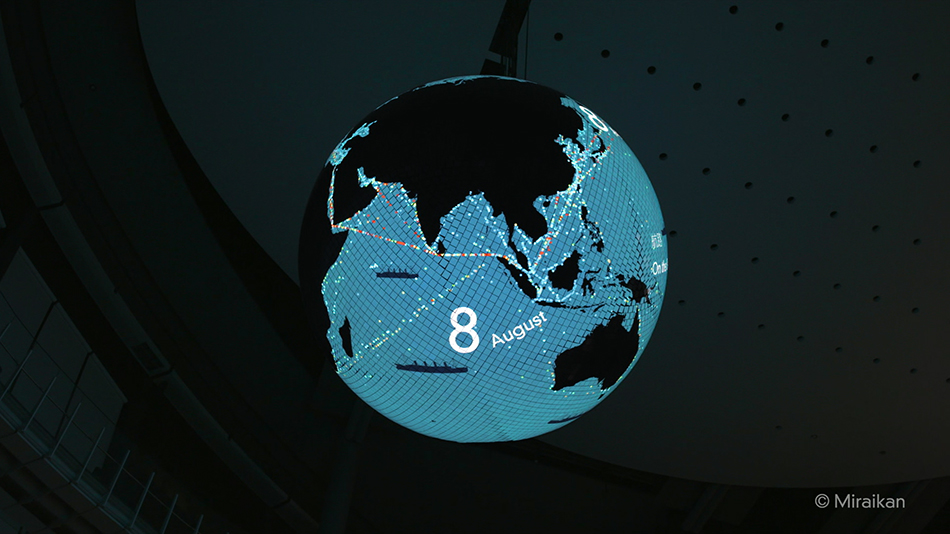
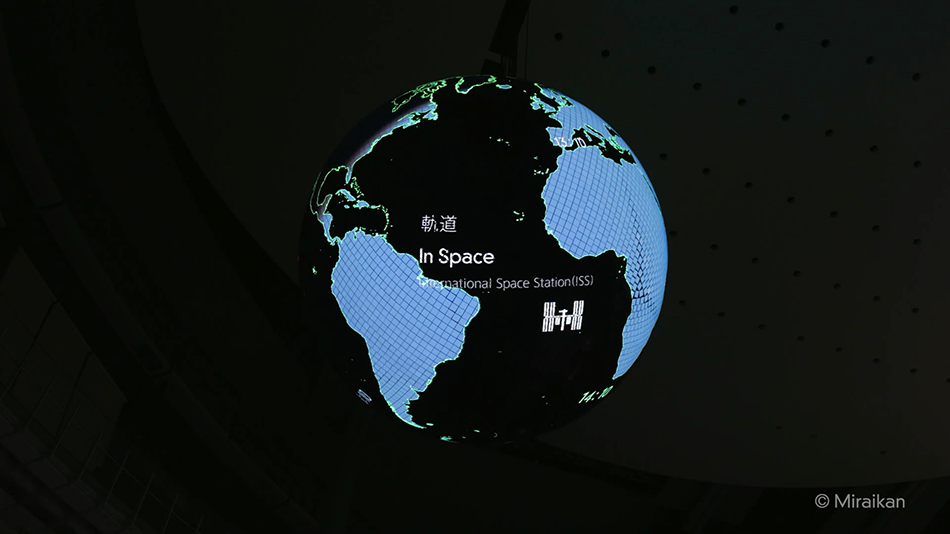
- Aviation / Ocean Vessel / ISS:
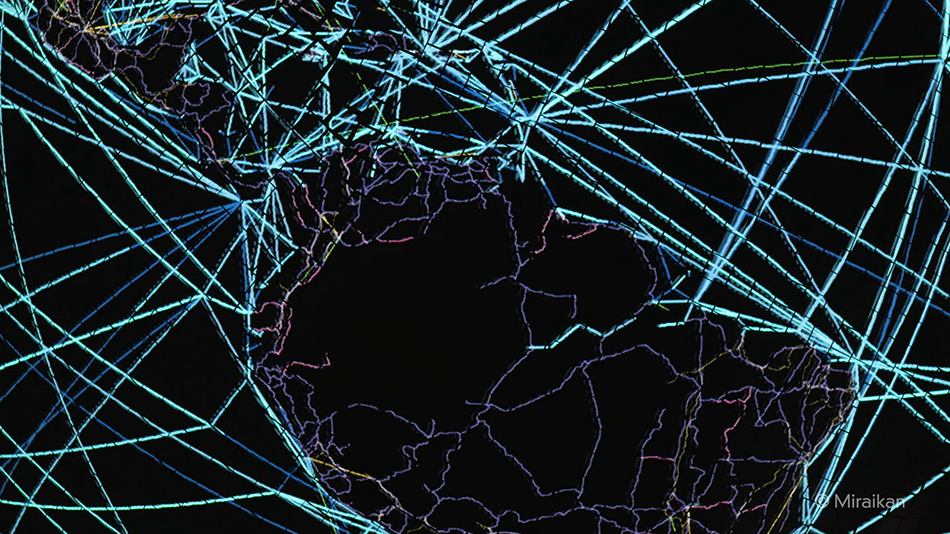
We used visualization of graphics so that you can have a feel for timescale contained in relevant data such as annual number of marine navigation by ocean vessels, load capacities, speed of ISS (International Space Station). For airplanes, you will notice some of flights leave in the night which will arrive at the destination in the morning to meet human activities in the daytime. *Date provided by: Chuo University Toriumi laboratory
●航空、船舶、ISS
データの持っているタイムスケールをなるべく体感できるように可視化されたグラフィック。
一年間の船舶の航行。積載量。ISS(国際宇宙ステーション)のスピード。
航空機は、人間の活動にあわせて、夜に飛び立ち朝到着する便があるなど、人間の活動が垣間見れます。
データ提供: 中央大学 鳥海研究室
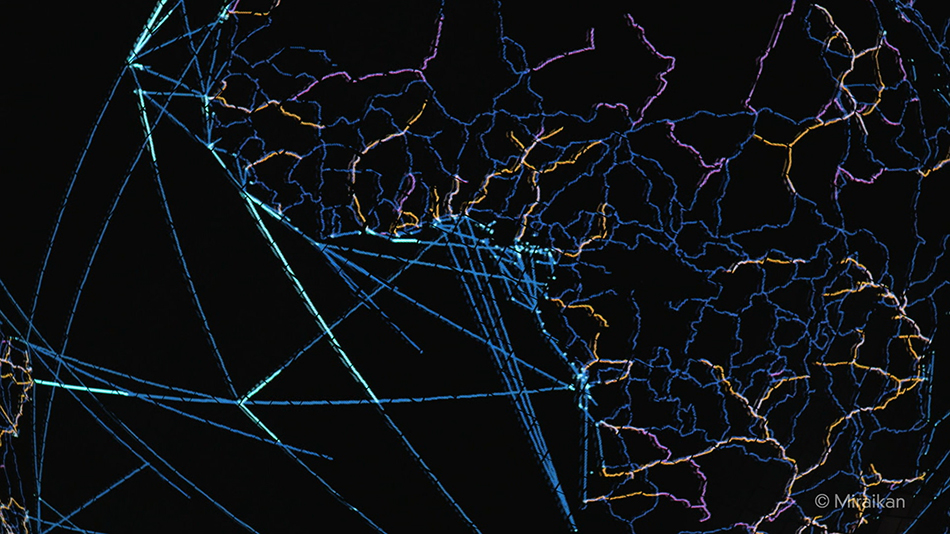
-Land Route / Railway Line:
You will also notice how land routes and railway lines are spread as they are layered over land form and the shape of nations
●陸路・鉄路
地形、国に重ね合わせ、陸路、鉄路がどのように張りめぐらされているかわかります。
Developments
For data visualization, we have created our own production applications such as the one which can be intuitively used as a tool for production assistance over global screen.
データのビジュアライゼーションのために独自の制作アプリケーションをいくつか開発しました。 球体スクリーンで直感的に制作していけるような制作支援ツールが主です。
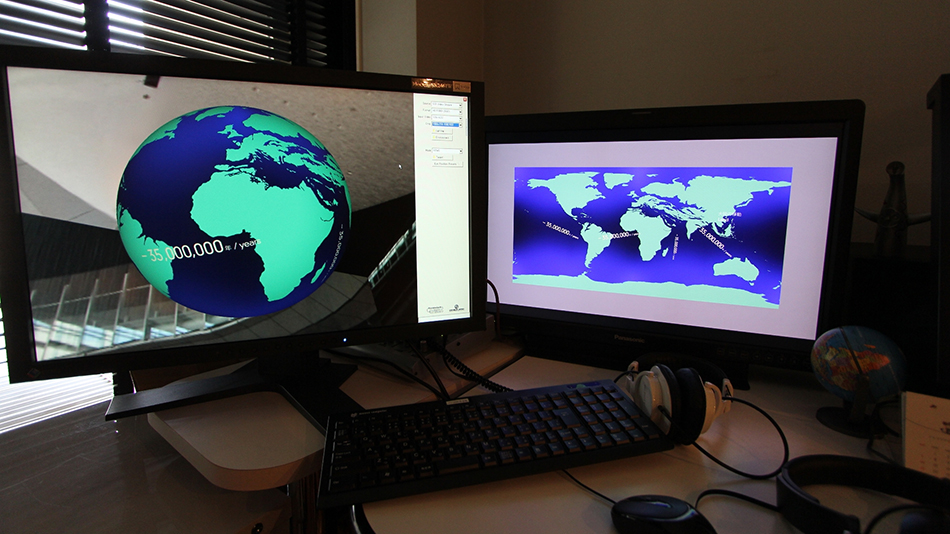
omni Geo view
This is the system of simulating how a permanent program exhibition screened at Symbol zone of Miraikan will actually look like. As motion graphics being drawn up can be reflected over the spherical body real-time, it is possible to proceed with the production while grasping an image of how it looks like in Symbol zone of Miraikan.
常設展示として上映される日本科学未来館のシンボルゾーンでの実際の見え方をシミュレーションできるシステム。 描画中のモーショングラフィックスがリアルタイムで球体に表示され、シンボルゾーンでどのようにみえるか感覚的に把握しながら制作していけるシステムです。
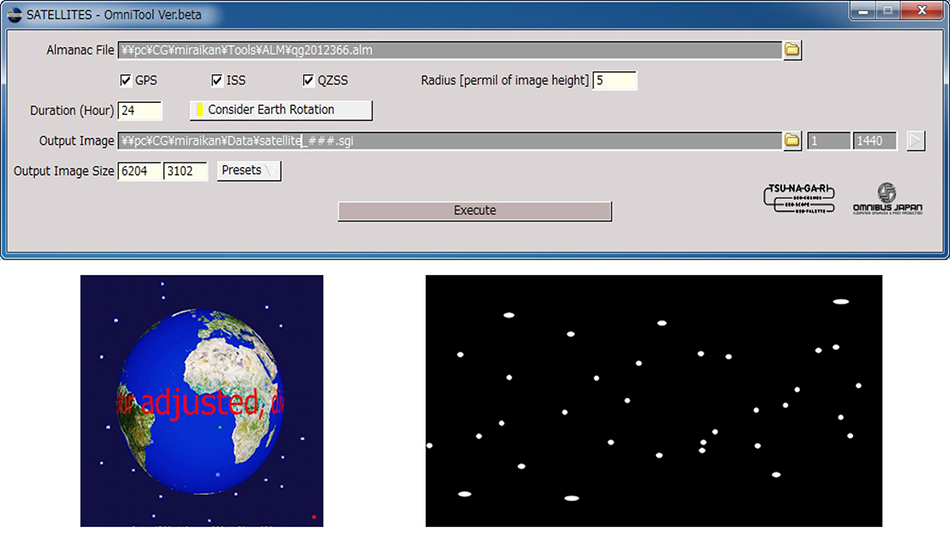
Satellites
By using data of satellite location released by JAXA, this system can draw locations of GPS satellites.
JAXAの公開している衛星位置のデータからGPS衛星の位置を描画するシステム。
Route
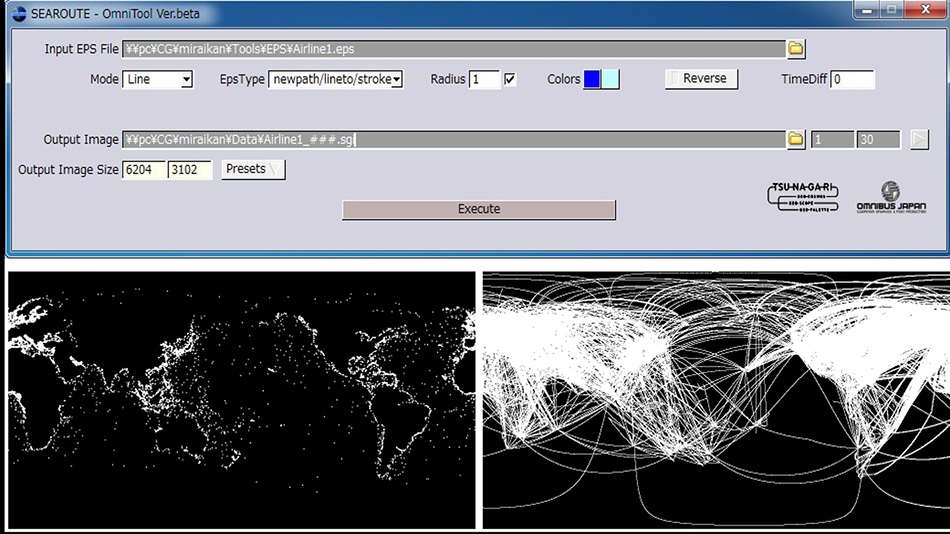
This is a creative tool for drawing the route based on the file containing the route map in eps format.
While we were requested to draw complicated route map in 6K resolution, this application made it possible to draw in several minutes by RAM rendering. Change of colors, speed of drawing lines, direction of drawing, etc. can be controlled by parameter. We can also easily repeat the process of changing colors, the speed of connecting lines, etc. by trial and error.
.
EPSの路線マップから、ルートを描画していくクリエイティブツール。 6Kの解像度での複雑な路線図の描画が要求されましたが、それをRAMレンダリングによって数分で描画できるシステム。パラメーターで色や線が描かれるスピード、描画の方向などを操作できます。 色や、つながっていくスピードなどトライアンドエラーしながら容易に繰り返すことができました。
| Client |
|
| Director |
|
| Motion Graphic Designer |
|
| Development |
|
| Music |
|


